Sep 22, 2012

Authorization in BI 7 - Part 1

Authorization in BI 7 - Part 1

via Content in SCN by Priyanka Joshi on 5/22/12

This blog will give the information related to Authorization concept available in SAP BW. Also, steps are given to maintain report related authorization.

Why is Authorization required in SAP BW?
  • To avoid the unwanted access to various objects as well as data in SAP BW system.
  • To assign restricted access of data to report users.

Authorization in SAP BW 3.x 
  • BW 3.x required Infoprovider Check to activate or deactivate authorization on the given reports.

What's new in SAP BI  7 for Authorization?

Prerequisites for authorization
  • Decide for which all reports an authorization is required.
  • Make list of infoobjects which will act as authorization specific infoobjects in reports.
  • Check whether all the required infoobjects are Authorization Relevant or not, if not marked then activate the flag.
  • Auth flag.JPG
  • Now check the Authorization Mode in SPRO
    • For SAP BW 3.x - Obsolete concept with RSR authorization objects.
    • For SAP BI 7 or above - Current procedure with analysis authorizations.
    • Auth_Mode.JPG
    • SPRO path
      • SAP Customizing Implementation Guide
        • SAP NetWeaver
          • Business Intelligence
            • Settings for Reporting and Analysis
              • General Settings for Reporting and Analysis
                • Analysis Authorizations: Select Concept
  • If you want to use any navigational attribute in authorization then it has to be authorization relevant in master data infoobject as shown in following screen.
  • Nav_attribute.JPG

Steps to create authorization object for SAP BI 7
  • Go to t-code RSECADMIN
  • Select Maintenance button 
RSECADMIN.JPG
  • Maintain Authorization : Initial Screen will appear.
  • RSECADMIN1.JPG
  • Enter the technical name of authorization object to be created.
  • Click on Create Authorization (F5)
  • Auth_ini_scrn.bmp
  • Maintain Authorizations : Create screen will appear with message in status bar 'Special Characteristics Missing'.
  • spl_char_msg.JPG
  • Why these special chars are required, see what SAP has to say about it
  • spl_char_msg1.JPG
  • Fill up short, medium & long text fields.
  • Click on the button 'Insert Special Charact.' as shown below.spl_char_ins1.JPG
  • Following objects with default selection will get added.
  • spl_obj.JPG
  • Further, get the list of all the 'Infoproviders' you want to add in this authorization object.
  • Each infoprovider has set of 'Authorization Relevant Infoobjects', all of them have to be added.
  • Check one by one infoprovider for the 'Authorization Relevant Infoobjects' as shown below.
  • chk_info.JPG
  • New window will pop-up for Infocube Authorizations.
  • cube_auth.JPG
  • You can specify required infoprovider's name directly or can use F4 help to get the name of infoprovider from the list.
  • As per the reporting requirement user either
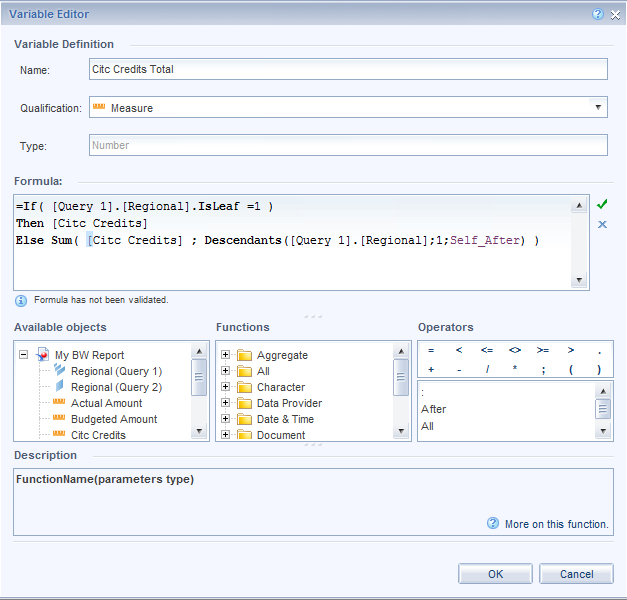
    • Insert Aggregation Authorizations: For the Totals in report, aggregation authorization ':' is used.
    • Insert Full Authorizations: It will assign '*'.
  • Once you specify the name of infoprovider and hit enter, list of all authorization relevant infoobjects, from the given cube/DSO will appear.
  • list.JPG
  • Select all the infoobjects from the list using Select All (F7) and hit enter.
  • All the selected objects will get added as shown below.
  • list1.JPG
  • Repeat the procedure for all the infoproviders.
  • As shown in the above screen shot, all infoobjects have value (*) in the intervals field. If you want to change value for any of the infoobjects, use following steps.
    • Use Details button to go to the maintenance screen OR
    • Double click the infoobject to reach the maintenance screen.
  • In the maintenance screen, 2 options are given.
    • Value Authorizations: You can specify single, multiple single or range of values.
    • Hierarchy Authorizations: Hierarchy node values can be assigned.
  • options.JPG
  • Value Authrozations.
    • 1st column - Including/Excluding : Specify either I or E to include of exclude the assigned value.
    • 2nd column - Operator : Specify value from the given list as per your requirement.
  • comp_op.JPG
    • 3rd & 4th column - Technical Character : Here you have to mention values which are required for the authorization.
                      1. Value (*) can be mentioned to assign Full Authorization.
                      2. Use Add/ Delete Rows option to add more single values.
                      3. Whenever single, multiple single or range values are maintained add ( : ) as 1 more row to avoid the summary calculation related errors at runtime.

  • Once you are done by assigning all the required values, click on Save button and exit.
  • If you make changes in the existing authorization object, on saving it pops up following message
  • savemsg.JPG
  • Select Yes and new changes with old definition will be saved.

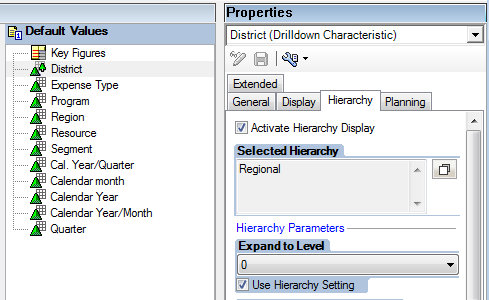
  • Hierarchy Based Authorization
    • To assign hierarchy node go to Hierarchy Authorizations in details of particular infoobject.
    • Click on Create button to assign hierarchy node.
    • Following window will pop up where you can select the required hierarchy and particular node.
    • hierarchy.JPG
    • Click on Select Hierarchy button to open the hierarchy variant screen.
    • New window will show the available variants of hierarchy.
    • hier_var.JPG
    • Double click on the required variant and Hierarchy variant name will get populated.
    • Now, detail node needs to be selected. Click on Select Node option.
    • detailnode.JPG
    • Select the required node from the list given
    • Once the values for Hierarchy & Nodes are selected, you have to set Type of Authorization.
    • For Type of Authorization following 4 options are given
      • 0 - Only the selected nodes
      • 1 - Subtree below nodes
      • 2 - Subtree below nodes to Level ( Incl. )
      • 3 - Complete hierarchy
      • 4 - Subtree below nodes to ( and Incl. ) Level ( Relative )
    • Now hit enter and main screen will appear where you can see Hierarchy Node value with type of authorization maintained.
    • When you are maintaining hierarchy node value then in the Value Authorizations only ( : ) value needs to be maintained to avoid the error at runtime.
    • Save the authorization object.

Sep 21, 2012

Major Lessons Learnt from BW 7.30 Upgrade

Major Lessons Learnt from BW 7.30 Upgrade

via Content in SCN by Erdo Dwiputra on 9/3/12

Dear SAP BW-ers,

This is my 1st time blog posting experience, I would like to share with you my journey when upgrading to BW 7.30 SP05 from BW 7.01 SP07.
Whatever I've written below is purely my opinion and not my employer.

It has been a painful project yet rewarding since this will enable the BW to be on HANA and have much better integration with other Business Objects tools.

Data Modelling Issue
·         There is a new data validation check procedure in BW 7.30, some of our daily batch jobs fails because of this new behavior. We have to remove conversion routine in 0TCTTIMSTMP and also write an ABAP routine to do the conversion during data loading. The same thing happened for 0WBS_ELEMT, we wrote a routine to fix this thing as well.

·         Cannot activate an InfoSource after the upgrade, run program RS_TRANSTRU_ACTIVATE_ALL in debugging mode and set the value of the parameter "v_without" to "x".

·         3.x DBConnect Data source stopped working after upgrade, needs to be regenerated because it was corrupted after the upgrade Go-Live

BWA Issue
·         If you are running on BWA 7.20 lower than revision 22, please set the query properties back into using Individual access instead of Standard/Cluster access. You can also do mass maintenance of every queries in an InfoProvider in transaction RSRT. If you don't do this you will be having major performance problem, for example a query that used to take 9 secs before upgrade will come back in 800 seconds if the cluster access is enabled.

Reporting Issue
·         Error #2032 because of dashboard crosstab data binding, we experienced this with most query that has 0CALDAY. You have to remove the 0CALDAY and then put it back again in the query so that the BICS connection will be refreshed from the query to the dashboard.

·         UOM conversion issue after the upgrade for some query, implements this SAP Note 1666937 to solve the issue.

·         Cell defined value was not impacted by scaling factor in BW 7.01, but in BW 7.30 it does. We have to make lots of adjustment in few queries because of this.

·         A condition on a hidden key figures no longer supported in BW 7.30, again some queries has to be adjusted because of this.

·         Dashboard Design 4.0 cannot be connected to BW 7.30 system until we upgrade SAP GUI version to 7.20 SP10.

This is the list of major issues that we encountered so far a week after Go-Live; hope that this will help your journey. I personally say to run the upgrade better we need to have a copy of production right before the upgrade and do the heavy testing few times and involve the business when doing so. You will then expect only few minor issues during the go-live.

Regards,
Erdo Dwiputra (original Contributor)

Sep 20, 2012

Chapter 3: Extended Star Schema (SCN)

Chapter 3: Extended Star Schema

via Content in SCN by Sunny Reddy on 9/14/12


  • Fact table consists of DIM ID and key figures.
  • Every Info cube has two types of tables
  1. Fact table
  2. Dimension tables
  • Info cube consists of one fact table (E and F), surrounded by multiple dimension tables.
  • Maximum number of dimension tables in an info cube is 16 and the minimum number is 4.
  • There are 3 system generated tables
  1. Data Package dimension table (Technical dimension)
  2. Time dimension
  3. Unit dimension
  • Maximum number of key figures in an info cube are 233
  • Maximum number of characteristics in an info cube are 248

Advantages of Extended Star Schema:
  • Faster loading of data/ faster access to reports
  • Sharing of master data
  • Easy loading of time dependent objects

Classical Star Schema:

  • In classical star schema, the characteristic record is directly stored in DIM tables.
  • For every Dimension table, a DIM ID is generated and it is stored in the fact table.

Differences between Classical Star Schema and Extended Star Schema:
  • In Classic star schema, dimension and master data table are same. But in Extend star schema, dimension and master data table are different. (Master data resides outside the Info cube and dimension table, inside Info cube).
  • In Classic star schema we can analyze only 16 angles (perspectives) whereas in extended star schema we can analyze in 16*248 angles. Plus the performance is faster to that extent.

Sep 19, 2012

Chapter 2: Info Objects (SDN)

Chapter 2: Info Objects

via Content in SCN by Sunny Reddy on 9/14/12

Info objects are the fields in BI system. These are divided into two types:
  1. Characteristics: Used to refer key figure
Ex: Material, Customer

The characteristics are divided into three types. They are:
  1. Time Characteristics
  2. Unit Characteristics
  3. Technical Characteristics

  1. Time Characteristics include day, month, year, and half-yearly, quarterly. They are generated by the system.
Note: Info objects are of two types,
  1. System generated (0)
  2. Customer generated (Z)

     b.  Unit Characteristics include currency, unit. (0Currency, 0Unit)
MaterialAmount0CurrencyQuantity0Unit
E620400Rs10

E621 500$12

They are always assigned to key figures type amount and quantity (as shown in the above example).
     c.  Technical Characteristics include 0requestID, 0changeID, 0recordID.

     2.  Key Figures: Used for calculation purpose
Ex: Amount, Quantity

The key figures are divided into two types. They are:
  1. Cumulative key figures
  2. Non-cumulative key figures

  1. Cumulative key figures are used when the data in the key figure field need to be added.
MaterialAmount
E621100
E622200
E623300
Total:        600 

    b.  Non-cumulative key figures are used in MM and HR related reports
PlantMaterialStock ValueDate
4002Pencil50028/04/2012
4002Pencil60029/04/2012
Records in the 'Stock Value' field are not added.

Steps to create info objects of type characteristics and key figures:
 
               Part 1:
  1. Go to RSA1
  2. Go to 'Info Object' selection
  3. Right click on the context menu > Select 'Create Info Area'
  4. Give the technical name (Always unique)
  5. Give description
  6. Click on Continue

Part 2:
  1. Right click on Info Area > Select create 'Info Object Catalog'
  2. Give technical name
  3. Give description
  4. Select Info object type 'Character'
  5. Click on Activate button

Part 3:
  1. Right click on Info area > Select create 'Info Object Catalog'
  2. Give technical name and description
  3. Select info object type 'Key Figure'
  4. Click on Activate button

Part 4:
  1. Right click on Info Object Catalog for characteristics
  2. Select create Info Object
  3. Give technical name (length between 3 to 8)
  4. Give description
  5. Click on Continue
  6. Give mandatory options in the 'General' tab page (like Data type, length .. )
  7. Click on Activate button

Part 5:
  1. Right click on the Info Object Catalog for key figures
  2. Select create Info Object
  3. Give technical name (length between 3 to 8)
  4. Give description
  5. Click on Continue
  6. For key figure of type 'Amount' and 'Quantity' we have to give 'Unit Characteristic' (0Currency/ 0Unit)
  7. Click on Activate button)
 
There are two types of data in SAP (ERP). They are:
  1. Master Data
  2. Transaction Data

  1. Master Data: It is always assigned to characteristic. From SAP BI point of view, master data doesn't change frequently

  Note: Master Data is always assigned to a characteristic. A characteristic is called master data characteristic if it has attributes, text and hierarchies.


  1. Attributes: These are info objects which explain a characteristic in detail. These are divided into two types:
          a. Navigational attributes
          b. Display attributes

Steps to create Attributes (type characteristic):
                                      
                                       Part 1:
  1. Go to Info object of type characteristic
  2. Go to 'Display/Change'
  3. In the 'Master data text' tab page, check the 'With Master Data' checkbox
  4. Go to the Attribute tab page
  5. Give technical name of attribute
  6. Click Enter
  7. Give description
  8. Give data type, length
  9. Click on continue
  10. Activate the info object

                                       Part 2:
  1. If the info object is already in the system, copy the technical name of the info object
  2. Go to attribute tab page of char
  3. Paste the technical name of the info object
  4. Click on Activate button

Note: Key Figure can be an attribute to a characteristic and it can only be a display attribute

Steps to enable Texts:
  1. Right click on the info object, select change, go to Master Data Text tab page, select the check box Text


Company CodeAmount
India2000
USA2500

Company CodeSales OrgAmount
IndiaHyderabad2000
Bangalore2000
USANew York2500
Washington D.C2500

Company CodeSales OrgDivisionAmount
IndiaHyderabadAmeerpet1000
Begumpet1000
BangaloreElectronic City1000
Silk Board1000
USANew York7th Street1250
9th lane1250
Washington D.C8th street1250
10th street1250

                                       Navigational Attribute: We can drill down using navigational attribute. It acts as characteristic in the report.
                                       Display Attribute: We cannot drill down using display attribute

                                       Note:
  1. Attribute Only: If you mark the characteristic as exclusive attribute, it can only be used as display attribute but not as navigational attribute.
  2. The characteristic cannot be transferred into info cube directly.

                                       Steps to change attributes from navigational to display:

  1. Go to 'Attribute' tab page, in column 'Navigation On/Off', select the pencil like structure.
  2. When changing display to navigation, give a description, click on activate button.

Steps to create attribute (type Key Figure):
  1. Go to info object, go to 'Attribute' tab page
  2. Give technical name
  3. Click on Enter, Select radio button 'Create attribute as key figure'
  4. Click on Continue
  5. Give description and data type
  6. Click on continue
  7. Click on activate button

                                       Tab Pages of Characteristic:
  1. General tab page:
  2. Data Element: Naming convention of data element (technical name of info object). It is like a field on database level
  3. Data Type: Here we have Char (1-60), string, Numeric (1-60), Date (8), Time (6)
  4. Lower Case Letters: If the characteristic is having lower case letters, select lower case allowed option
  5. SID Tables: Surrogate ID or Master Data ID
  6. Business Explorer: The selections which are in the Business Explorer tab page are by default displayed at report level
  7. Master Data/Text tab page: Info object has the following tables
P -> Time Independent display attributes
Q -> Time dependent display attributes
X -> Time Independent navigational attributes
Y -> Time dependent navigational attributes
Text: If we select this option, we can have text for the characteristic
Hierarchy: To enable hierarchies, we have to select the hierarchies
Attribute: In this, we give the attributes for a characteristic          
     ii. Text: The same report can be selected in different language in different country. This is because of the 'Text' functionality    
     iii. Hierarchy

Sep 18, 2012

Chapter 1: Introduction to SAP BI from SDN

Chapter 1: Introduction

via Content in SCN by Sunny Reddy on 9/13/12

  • BI - Business Intelligence (Reporting and Analysis)

   
  • OLAP: Online Analytical Process (SAP BI)
  • OLTP: Online Transaction Process (SAP SD, MM, FICO, ABAP, HR)
  • Basics:
  • BI is a data warehousing tool
  • ETL: Extraction > Transformation > Loading
  • BI is used by middle level and high level management


  • PSA (Persistent Storage Area): Used to correct errors.

Merging SAP and non-SAP data: Overcoming Hierarchies

via Content in SCN by David Taylor on 5/29/12

Even though SAP provides connectivity to both SAP BW and relational data, combining these data sets into a single report can be tricky.  There are lots of ways to do it:
  1. A Single, Federated Query combining an SAP DSO and Relational data at the universe tier.
  2. A Single, Federated Query combining an SAP Infocube Relational Schema + Relational data at the universe tier.
  3. Two non-Federated Queries, one BW Query and one Universe query, merging the data at the report (WebI) tier.

The first method has long been supported but you loose all the value-added elements of the Infocube.  Most customer I work with want to connect to the BEx Queries that run against the Infocubes.  The second method is supported, but not recommended.  The semantic layer via the federation engine is able to interrogate the Infoprovider and expose it as a relational star schema.  Here are a list of some of the elements you lose:
  • BW Hierarchies
  • Restricted and Calculated Key Figures
  • BEx Queries
  • BW Variables
  • Currency & Unit Conversion
  • Exceptions, Conditions

>> I always use the third approach, but there's one big problem.  Hierarchies have remained a huge challenge.  Until Now.

SAP Hierarchies

Many customers have SAP Hierarchies that they have developed that they want to combine with non-SAP data.  The problem is that when you merge the data at the report level, the roll-ups no longer work.  Today I've discovered that there is a "secret formula" that solves this issue and I think you'll like what you see.

Step by Step

Let me walk you through an example step-by-step.  The first thing I have to do is create an Infocube with a hierarchy and create a BEx Query on top of the InfoCube.  In my case I have a characteristic called District, which contains a hierarchy called, Regional.  In my example the hierarchy is a simple, two level hierarchy.


I then created a BEx Query for that leverages this hierarchy.


Next I created an OLAP connection within the CMC to the associated BEx Query.


Once the connection to the SAP data is complete, I created a data set in SQL Server which matches all the base level members.  Here is a view of the data:


[/caption]  I then created and published a universe that connects to the SQL Server data and returns the correct results.


Now it's time to create a WebIntelligence Report.  First I'm going to connect to the BEx Query and pull in Regional (Hierarchy) as well as the measures Actual Amount and Budgeted Amount.  Next, I accessed the Data Access > Data Providers > New data provider and selected Universe.  This allowed me to connect to the SQL Server universe and added the elements from SQL Server and run the second query.


Now I had all the data I need from the two queries.  One query is pulling data from BW with a hierarchy and the other query is pulling data from SQL Server.  Here is what the data providers looked like once both queries have been added to the report:


Now I simply needed to merge the two data elements Regional together.  All you have to do is highlight to two values and choose Data Access > Data Objects > Merge.  From here select the Regional objects.


Once that was done, the key figures from the SAP and Relational data can be combined together is the same table and this is what the results look like when put into a table.  The first 3 columns come from SAP and the last two columns come from SQL Server:
You see that the elements all match and appear together at the lowest level, but the parent values are not rolling up.  This is because WebI is also looking for the values Metropolitan and Rural in the dataset.  If I was not doing simple addition, I would have no choice but to add these into the original data in SQL Server.  In my case I am doing a simple roll-up SUM(), therefore I can fix this with a new formula!

Magic Formula

Here is the magic formula:

=If([<olap_webi_query_name>].[<olap_hierarchy_name>].IsLeaf =1 )
Then [<relational_measure_name>]
Else Sum( [<relational_measure_name>] ; Descendants([<olap_webi_query_name>].[<olap_hierarchy_name>];1;Self_After) )

I say "magic" because when I first saw this formula, I was blown away.  Now that WebIntelligence contains a number of native OLAP functions, these types of OLAP-centric calculations are possible.

Here is my original blog post on this topic >> http://bit.ly/KZJlH8

Leverage This New Formula

In my case I had two key figures which were coming from SQL Server, so these values would need to be replaced with formulas that included this new OLAP roll-up math.  I created a formula for the Citc Credits first:

I did the same for Turbine Totals and ended up with the following Available Objects.  You can see my two new Variables: Citc Credit Totals and Turbines Total.


Once I replaced the SQL Server key figures with the new OLAP formulas, I was able to see the magic in action.


Conclusion

It's not perfect but it works... and it works very well.  Ideally it would be best if we could merge the data at the semantic layer so that for each report the user didn't have to have to create a series of formulas to solve this problem... however until a better semantic layer solution exists that supports hierarchies like this, I'm going to be a big fan of this new workaround.


Aug 12, 2012

Successful SAP BI Project which went live and includes SAP Business Objects ...

via Content in SCN by Adir Oren on 4/14/12

BICS present a successful SAP BI Project which went live and includes SAP Business Objects 4 over SAP BW 7.1

Hi All,
In this article we will share with you a success story of one of our SAP BI project using SAP Business Objects 4 over SAP BW 7.1
Customer: SAP Customer running SAP Best Practice
Users: Over 50 Business Intelligence users

Project scope:
  1. Implementation of the SAP BI Best Practice with COPA,PP,MM,FI,SD,PUR,IV,PS
  2. Enchantment of Info Objects Material, Customer , SD & COPA BI modules
  3. Implementation of Organizational KPI's for 6 business  areas 

Architecture:
The Data warehouse is SAP BW, Front end tools is SAP Business Objects 4 web intelligence for management /analysis reports + crystal reports 2011 for transactional reports
BW-We have 2 SAP BW 7.1 landscapes: BW Dev acting also as BW QA and BW Production
BO-We have 2 SAP Business Objects landscapes – BO Dev , BO Prod

Authorization concept:
The authorization module includes 3 tiers
Tier1- Data level security coming from SAP BW
Tier2-SAP Business Objects web intelligence technical tool functionality (authorization over what kind of buttons and functionality the BO Webi will present for each user)
Tier3- SAP Business Objects control on the list of folders available for each user
Training:
Training method  was" train the trainer"- we have trained the Customer IT personal , they are responsible for User training.

Challenges:
1.We are the first service companies in the local market who went live with a full SAP BI project using SAP BW & SAP Business Objects 4, we had couple of problems with query performance, which eventually was stable after enhancement of SAP Notes , BO system tuning and last but not least we have established several of key development procedures for Business Object reporting over SAP BW Query as semantic layer.
2.There was several of Web intelligence functionality that wasn't working over BW, some of them we have developed workaround, some of them reported to SAP and will be fixed in FP3 and future development 

Summary:
Project went live as scheduled, SAP Business Objects reporting went live and kicking, good SAP support from SAP locally and globally
For more information
www.bics.co.il | coe@bics.co.il |visit their site SAP BI Center of expertise

Aug 5, 2012

Are You Hiding Your Data Sins?

via Content in SCN by Randy Garrison on 7/31/12

A single source of the truth. A great mantra – but hard to achieve as data types, volumes, and frequency continue to explode. A company that embarks on a campaign to create one source for all its reporting and analysis needs must traditionally undertake a massive enterprise data warehouse project, relying heavily on "extraction" of multiple layers of data from underlying ERP solutions. Business logic is then applied to the data, cleaning it and enhancing its usefulness, in a process referred to as ETL – extract, transform, and load.

The Promises and Perils of ETL
ETL works well in traditional environments where reporting solutions are outside the transaction system – those designed so reporting and analysis functions didn't impair or slow transactional systems. In such systems, users would simply extract the data and then use tools to report and analyze.
Many companies, however, use the ETL "cleansing" process to hide the sins of bad transactional system data. Such an after-the-fact approach creates multiple problems. Data that has been cleansed and changed can be difficult to reconcile with underlying sources. And when you pull together data from multiple sources, cleanse, and report it, it can look fine at a summarized level – but unsummarized, it is still full of outliers or anomalies... useful, but definitely not the same. In addition, ETL-based changes to data rely on predefined (often IT-driven) extraction configurations not visible to the report user. Because the quality of underlying transactional data is hidden, business processes remain less than optimized. Cleaning up such an environment requires costly data management projects.

Finding and Correcting Bad Data
Powerful computing tools can now work with transactional data directly in the data sources, making it possible to quickly spot bad data and trends. The SAP® HANATM platform, for example, is an in-memory computing appliance that runs analysis on big data directly from transactional systems. Its speed and power make it possible to analyze data where it resides, without exporting it.

Taking Action with SAP HANA
Using SAP HANA, employees can use information and analysis within the context of business processes – then take immediate corrective action. Users can continually monitor and refine a process in real time, identify backlogs and opportunities, and affect performance as it happens – for example, adjusting inventory levels on the fly or authorizing limited-time promotions for in-store customers.

Learn More
Business Analytics Services from SAP can help you right your data sins while crafting an overall information strategy. Our consultants can also speed analysis across your organization using in-memory computing advancements such as SAP HANA.
For more information on how Business Analytics Services from SAP can help unlock the value of your data and support better, faster, data-driven business decisions, visit us online.

Aug 3, 2012

Making Business Intelligence Work for You

via Content in SCN by Tom Kurtz on 7/26/12

Making Business Intelligence Work for You

Business Intelligence (BI) is a top priority for many companies. Used effectively, it can drive insights into customer behavior, pinpoint new market opportunities, optimize marketing spend, leverage competitive intelligence, and more. Because of the obvious benefits, most companies have evolved from an attitude of "Should I utilize business intelligence?" to "How do I get the most out of business intelligence?"

Yes, choosing BI is a wise move. But once you've made the decision to invest, how should you proceed? How can you ensure that you get the most from your investment? How do you make BI work for you?

Three Approaches for Successful BI Strategies

Over the past decade working with hundreds of customers to enhance their business value, SAP has seen three successful approaches to getting companies started with BI:

1) Holistic BI Strategy

In this approach, you take a step back and evaluate your entire BI strategy in the context of your business. You'll need to identify your business vision, strategies, and related growth initiatives and ensure alignment between your vision and your infrastructure needs. Execute by creating a long-term project roadmap and prioritizing your BI spending.


BI Strategy.JPG

2) Focused Analytic Solution

If you have a high-value business use case already identified, consider developing an initial analytic solution targeting it. This approach addresses immediate business needs, while creating an opportunity to showcase your success to other parts of the business.


Metric Framework.png

For this focused approach – for example, with a visualization quick start – you'll need to analyze four key areas:

  • Metric framework. There are literally hundreds of metrics a company could calculate, monitor, and view. However, certain metrics are relevant to specific strategic initiatives. Identify which metrics are the most applicable to the issue you're addressing, and why. You'll also need to become familiar with how your metrics decompose and who in your organization views that information. For example, if a VP of operations at a retailer cares about COGS, and sees that it is tracking high for a given period, he will probably want to understand why. You may need to investigate a series of submetrics – product cost, landed cost, shrinkage – to fully understand the root causes of the increase in COGS.
  • Visualization design patterns. Identifying your metrics framework and who in your organization is viewing the information allows you to understand how that information needs to be presented. Do you have executives who need aggregate information in the form of dashboards or scorecards? Do you have analysts that require drill-down reporting capability? Do you have mobile users that require information displayed on devices?
  • Data design patterns. Once you know what you want to see and how to display it, you'll need to determine the data required. This is one of the most important aspects to strong BI; if you don't have a sound data strategy, your BI results will be compromised. What data is available? Where might you have data gaps? And what is the cost of acquiring new data vs. the benefit to the business?
  • Solution architecture. Finally, what technical infrastructure is required to support your analytic solution? What are the various server considerations?

3) Architecture Framework

For some IT executives, this is the logical place to start. Begin by determining your infrastructure requirements and gaining an initial technical understanding of the tools you will be deploying. Such a framework will help you better support the business as you get into the planning and implementation stages. You'll need to systematically assess:


  • The size of your enterprise deployment
  • Security and authentication
  • Positioning of BI tools
  • Server configuration
  • Installation requirements
  • Current number of users, types of users, number of concurrent users, forecasted user growth
  • Disaster recovery plans, strategies, and backup
  • Content integration needs
Arch Design Considerations.png

Any of these three options can be an effective starting point; the choice comes down to where your business is now, and what is required for it to be successful. Regardless of where you start, though, you can – and should – expand to take advantage of one or both of the other options as your BI footprint matures. Perhaps you want to start with an analytic solution to show success, then once that succeeds, drive more sponsorship into a full BI strategy. Or maybe you want to begin by developing your architecture framework as you get your IT story in place, then embark on an analytic solution that solves a specific use case. There are many approaches to BI – ultimately, it's your business, and your decision.

Every day, SAP Services helps companies work through critical business decisions like these. Watch our latest World Tour presentation Decide Better: Best Practices with Business Intelligence given by Tom Kurtz, Global Practice Director HANA Services at SAP Consulting at http://tinyurl.com/3za6kmw.

To learn more about how we can help ensure that BI delivers maximum benefits for your business, visit us at www.sap.com/services.

What approach to BI has worked for your organization?