Apr 2, 2013

The OLAP Compiler in BW-on-HANA

via Content in SCN

This blog is about a functionality that I consider as one of the crown jewel of BW-on-HANA. The approach has evolved over many years; early discussions started around the time when the BW accelerator (BWA) got initiated (around 2003, project Euclid) and were ignited by the fact that BWA (and its sequel HANA) provided a layer for processing multiple and sequenced calculations close to the data layer. This has not been possible before as we did not have control over the data processing layer of the standard RDBMS underneath the classic BW. The latter is restrained by SQL as the standard API. This blog – as a side effect – will show in what way SQL limits analytic processing, especially fast analytic processing. Also, it will become apparent that BW's OLAP has converted into a kind of sophisticated compiler for HANA's calculation engine. That combination will be hard to beat when you go beyond demo, "hello world style", single table group-by and other simple analytic examples. 

An Example
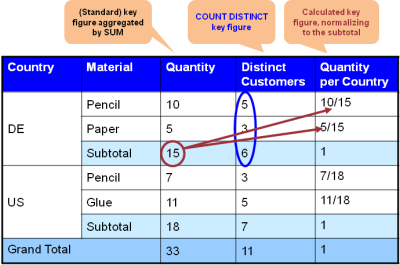
Let's look at an example which looks as if it was of "hello world style" but which quickly reveals some challenges. In figure 1, a standard OLAP query result is displayed. 

It shows the quantities of sold items per product and country. In addition, the number of distinct customers who bought those products can be seen. Finally, the quantity relative to the overall number of sold products in a country are presented as percentages.

Figure 1: Example of a result of an OLAP query

Some Challenges in the Example
Now when you carefully look at the example of figure 1 then you see some of the challenges: 
The numbers of distinct customers do not sum up. There are 5 distinct customers buying pencils and 3 buying paper, both in Germany (DE), but only 6 – and not 5+3=8 – buying products in DE. There must be 2 customers that have bought both, pencils and paper. In processing terms this means that the subtotal (e.g. by country) cannot be calculated out of the preceeding aggregation level (e.g. by country and product) but needs to be calculated from the lowest granularity (i.e. by country, product, customer). The calculated key figure quantity per country refers to the key figure quantity and sets the latter's values in relation to its subtotals. This means that the quantity key figure and its subtotals has to be calculated prior to calculating key figure quantity per country. This means there is an order of processing imposed by mathematics.

Figure 2: Challenges in the example

What you can do with SQL
In order to calculate the result of figure 1, classic BW (or SQL-based OLAP tools in general) would issue a SQL statement that retrieves a rows similar to the one shown in figure 3. That row constitutes the base set of data from which the result of figure 1 can be calculated. It is not the final result yet but from that data it is possible to calculate the final result as indicated in figure 1. Don't get fooled by the small amount of data shown in figure 3, As you can see, it is necessary to get the details on the customers in order to calculate the distinct customers per group-by level. In real world scenarios – just imagine retailers, mobile phone or utility companies – the customer dimension can be huge, i.e. holding millions of entries. Consequently and caused by real-world combination, the result of the SQL query in figure 3 is likely to be huge in such cases. That "sub-result" needs to be further processed, traditionally in an application server, e.g. BW's ABAP server or the Web-intelligence server. This implies that huge amounts of data have to be transported from the DB server to such an application server or a client tool. 

Figure 3: Rowset retrieved by a SQL query to calculate result of figure 1

By the way: BWA 7.0 accelerated exactly this part of OLAP query processing, i.e. the basic data query. Subsequent processing on top has still been executed in the application server. This is not a big issue as long as the OLAP query is dominated by the SQL processing. However, it comes short - as in this example - when the result of the basic SQL query gets huge and requires significant data transport from the DB to the application server and then significant data traversals to calculate the final result. 

The "OLAP Calculation Graph"
Now based on the result shown in figure 3 there is a natural sequence of how to calculate the various formulas (behind the calculated key figures) and the various group aggregations (i.e. the subtotals and totals). 
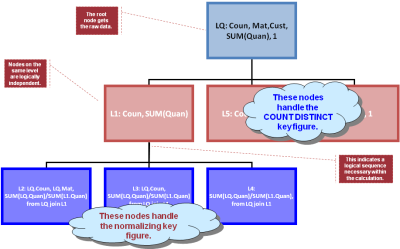
Many of those subsequent calculations can be considered as SQL queries on top of figure 3's result. Figure 4 shows the resulting dependency graph: LQ is the label for the query of figure 3; L1, L2, ..., L6 are "queries" or calculations on top. BW's OLAP compiler basically derives that graph and sends it down to HANA's optimizer (using a proprietary interface), HANA optimizes and processes that graph and sends back the result. Please beware that the result is not a rowset, at least not in the normal sense. It is heterogeneous sets of rows that are returned and that need to go into the appropriate result line in figure 1. In short: the compiler creates a graph to be sent to HANA and then there is a postprocessing step that receives the result and converts it to the desired result set of the OLAP query (i.e. a cellset as in fig. 1). 
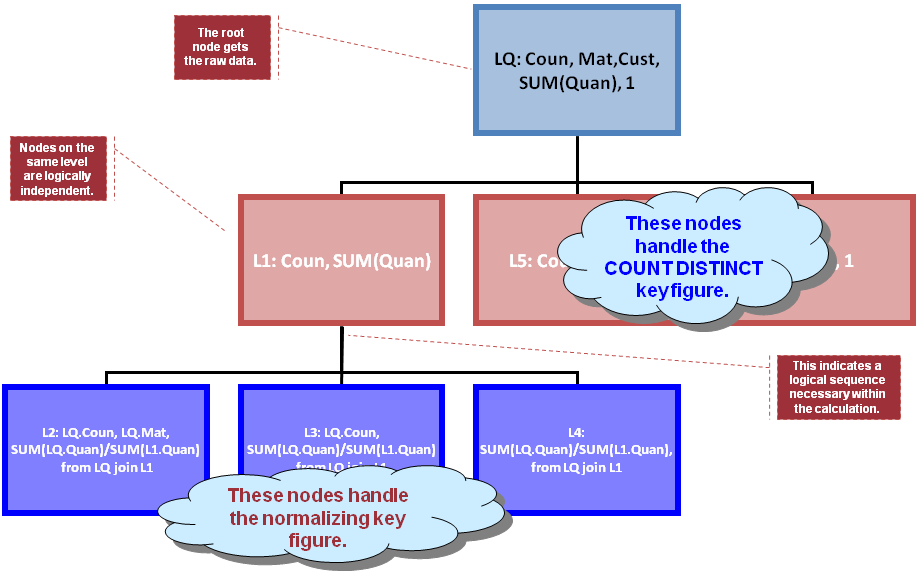
Figure 4: Graph derived for processing the final result (as in fig. 1) from the data in fig. 3

Concluding Remarks
Author think there is a few fundamental things that become apparent even by looking at the simple example discussed in this blog: Even though individual processing steps can be expressed via SQL, it is in the end a well defined sequence of processing steps that yield the result.

Accelerating the individual steps helps but falls short. For example, an OLAP client tool can derive an OLAP graph like the one in fig. 4. One alternative is that it issues for each node in that graph a SQL or SQL-like query. To avoid the data transport, it can materialize intermediate results. However, this constitutes an overhead. As a second alternative (the one frequently met in practice), it is possible to issue only the basic query - labeled "LQ" in fig. 4 - and transport a potentially huge result set over the network to the client in order to calculate the rest on the client level. This is the traditional approach which obviously also suffers from the transportation overhead.

BW-on-HANA resolves those issues by providing a powerful option to define an OLAP query - i.e. the BEx query - this is a precondition to allow all of that in the first place, sending down the entire processing graph to HANA and allowing HANA to optimize and pipeline the individual processing steps, and
having the capability to assemble the partial results of the processing steps into the final (OLAP) result.

Credits
Let me emphasize that I'm the mere republisher of this blog. The real credits go to the real author and bright minds behind this approach who sit in BW's OLAP and data manager teams.This blog is cross-published here. You can follow the author on Twitter via @tfxz.

Mar 29, 2013

Store locations from SAP BW to Google Maps

via Content in SCN

There are times when we do something for one pure and simple reason: "Because We Can". So when Wally wanted to see all the customer stores in the country in Google maps, I said why not!

We can maintain a master data with the coordinates (latitude, longitude) in SAP BW and write a code which will read these coordinate from the master-data table and generate a geoRSS or a KML or a KMZ file.

There is a growing trend among internet users to use these file formats to exchange publish and consume geographical data, and moreover google maps consume them readily. These formats are more or less like a normal xml file with a few extra tags, that's all…

The only question in my mind was whether I could generate the KML file or not; but there is no reason why we can't considering that we can quite easily generate a XML.

So once we generate the KML through ABAP we can place it in share-point or some webhosting site and consume it directly though google maps.

It's cool for the customers to view their stores/plants in the map, and to know that they are indeed having a footprint in the information superhighway. 

In fact we can we can write a small app that will handle this in a more sophisticated manner in an Iphone.

Mar 21, 2013

How to use OpenDocument with BEx variables


While the official OpenDocument guide is a great resource and explains in detail how to use OpenDocument syntax, We have not seen a good documentation explaining how to use OpenDocument in conjunction with SAP BW BEx variables, and yes, there are syntax differences depending on the different BEx variable types. 

What is the OpenDocument interface?
The OpenDocument interface allows you to open reports that are saved in the BI LaunchPad by using URL hyperlinks. You can take advantage of the OpenDocument syntax and parameterize the report to be opened.

How to pass values to BEx variables in general?
As everything in SAP BW, there is always a Text and a Key for every record in your report. The text is clearly not unique though, it depends for example on the language of the user that is currently viewing the report. On the other side most of the users are not very comfortable seeing and working only with technical keys, you should always pass both: Key and Text.

How do I construct an OpenDocument URL in general? 
While you can construct your own URL manually by carefully reading the manual, there is much fancier way: Use the hyperlink wizard! The hyperlink wizard is available only in Web Intelligence Web Mode (DHTML), it is not available in RIA mode (Java) nor in the Rich Client. You can open the hyperlink wizard by right-clicking on a field > Linking > Add Document Link:


After you select a target document in the hyperlink wizard, you will be presented with all the prompts of the target report. In this example I have a prompt (from a BEx variable) on a dimension object named "Material", an example of a material is a material named "Ten" with key "010". The following would be a correct way of passing a single material by using the dimension objects in a table:

In the first box you should provide a Text (Dimension Object), and in the second its corresponding key. In the screenshot above "Z_SINGLE_OPT_TEXT" corresponds to the description of the BEx variable, on the other side, the generated hyperlink will use the technical name of the variable.

How do I pass Single Values?
If you use the hyperlink wizard to pass a single value variable, you will notice that the wizard will use two parameters lsS for the Text and lsI for the key. If for example you click on a material "Ten" with key "010" using a variable "Z_SINGLE_OPT" (technical name):

You will get a syntax like this: 
"…lsSZ_SINGLE_OPT=Ten&lsIZ_SINGLE_OPT=010"

Notice that code is hard coded with the values for a better understanding, but of course you can use dimensions here.

How do I pass Multiple Single Values?
By separating individual values with a semicolon (;), you can pass multiple single values at a time. For example:
The corresponding syntax equates to: 
"…&lsMZ_MSV_OPT=Ten;Fourty&lsIZ_MSV_OPT=010;040"

Notice that lsM is used to pass multiple single values.

How do I pass Ranges?
When passing ranges you must separate the minimum and maximum value with two consecutive dots (..). The start and end of the range must have square brackets that you have to create manually:


Generated syntax: 
"…lsRZ_RANGE_OPT=[Ten..Thirty]&lsIZ_RANGE_OPT=[010..030]"

Notice that lsR will be used to pass ranges.

How do I pass nodes of a Hierarchy?
Passing a hierarchy node with standard text and key objects works fine most of the times, however I use following syntax (according to note 1677950) to avoid potential issues: [Hierarchy].key


In this case you will notice that a "0HIER_NODE/" will be inserted to all non-leaves in the hierarchy.

Generated syntax:
„…&lsSZ_HIER_OPT=Even&lsIZ_HIER_OPT=0HIER_NODE/EVEN"

How do I pass compounded objects?
In this case you need to make sure that the key that you are passing is not compounded (more Information in this blog post). You can achieve this by using formulas in the front-end e.g. "=right()" or by selecting the non-compounded key available since BI4 SP05:


Hope you enjoyed this introduction into using OpenDocument with BEx variables

Original Article of : Victor Gabriel Saiz Castillo

Feb 11, 2013

Create an InfoCube

Create an InfoCube

Creating an InfoCubeIn BW,Customer ID,Material Number,Sales Representative ID,Unit of Measure,and Transaction Date are called characteristics. Customer Name and Customer Address are attributes of Customer ID,although they are characteristics as well. Per Unit Sales Price,Quantity Sold,and Sales Revenue are referred to as key figures. Characteristics and key figures are collectively termed InfoObjects.

A key figure can be an attribute of a characteristic. For instance,Per Unit Sales Price can be an attribute of Material Number. In our examples,Per Unit Sales Price is a fact table key figure. In the real world,such decisions are made during the data warehouse design phase. InfoCube Design provides some guidelines for making such decisions.

InfoObjects are analogous to bricks. We use these objects to build InfoCubes. An InfoCube comprises the fact table and its associated dimension tables in a star schema.

In this chapter,we will demonstrate how to create an InfoCube that implements the star schema from figure. We start from creating an InfoArea. An InfoArea is analogous to a construction site,on which we build InfoCubes.

Creating an InfoArea

In BW,InfoAreas are the branches and nodes of a tree structure. InfoCubes are listed under the branches and nodes. The relationship of InfoAreas to InfoCubes in BW resembles the relationship of directories to files in an operating system. Let's create an InfoArea first,before constructing the InfoCube.

Work Instructions
Step 1. After logging on to the BW system,run transaction RSA1,or double-click Administrator Workbench.


Step 2. In the new window,click Data targets under Modelling in the left panel. In the right panel,right-click InfoObjects and select Create InfoArea….


Note
In BW,InfoCubes and ODS Objects are collectively called data targets.
Step 3. Enter a name and a description for the InfoArea,and then mark to continue.


Result
The InfoArea has been created.

Creating InfoObject Catalogs
Before we can create an InfoCube,we must have InfoObjects. Before we can create InfoObjects,however,we must have InfoObject Catalogs. Because characteristics and key figures are different types of objects,we organize them within their own separate folders,which are called InfoObject Catalogs. Like InfoCubes,InfoObject Catalogs are listed under InfoAreas.

Having created an InfoArea,let's now create InfoObject Catalogs to hold characteristics and key figures.

Work Instructions
Step 1. Click InfoObjects under Modelling in the left panel. In the right panel,right-click InfoArea–demo,and select Create InfoObject catalog….
Step 2. Enter a name and a description for the InfoObject Catalog,select the option Char.,and then click to create the InfoObject Catalog.
Step 3. In the new window,click to check the Info Object Catalog. If it is valid,click to activate the InfoObject Catalog. Once the activation process is finished,the status message InfoObject catalog IOC_DEMO_CH activated appears at the bottom of the screen.


Result
Click to return to the previous screen. The newly created InfoObject Catalog will be displayed,as shown in Screen

Following the same procedure,we create an InfoObject Catalog to hold key figures. This time,make sure that the option Key figure is selected Screen.

Creating InfoObjects-Characteristics

Now we are ready to create characteristics.

Work Instructions
Step 1. Right-click InfoObject Catalog–demo: characteristics,and then select Create InfoObject….
Step 2. Enter a name and a description,and then click to continue.
Step 3. Select CHAR as the DataType,enter 15 for the field Length,and then click the tab Attributes.
Step 4. Enter an attribute name IO_MATNM,and then click to create the attribute.

Note: Notice that IO_MATNM is underlined. In BW,the underline works like a hyperlink. After IO_MATNM is created,when you click IO_MATNM,the hyperlink will lead you to IO_MATNM's detail definition window.
Step 5. Select the option Create attribute as characteristic,and then click to continue.


Step 6. Select CHAR as the DataType,and then enter 30 for the field Length. Notice that the option Exclusively attribute is selected by default. Click to continue.

Note: If Exclusively attribute is selected,the attribute IO_MATNM can be used only as adisplay attribute,not as a navigational attribute. "InfoCube Design Alternative I Time Dependent Navigational Attributes," discusses an example of the navigation attributes.

Selecting Exclusively attribute allows you to select Lowercase letters. If the option Lowercase letters is selected,the attribute can accept lowercase letters in data to be loaded.

If the option Lowercase letters is selected,no master data tables,text tables,or another level of attributes underneath are allowed. "BW Star Schema," describes master data tables and text tables,and explains how they relate to a characteristic.
Step 7. Click to check the characteristic. If it is valid,click to activate the characteristic.

Step 8. A window is displayed asking whether you want to activate dependent InfoObjects. In our example,the dependent InfoObject is IO_MATNM.

Click to activate IO_MAT and IO_MATNM.


Result
You have now created the characteristic IO_MAT and its attribute IO_MATNM.

Note: Saving an InfoObject means saving its properties,or meta-data. You have not yet created its physical database objects,such as tables.

Activating an InfoObject will create the relevant database objects. After activating IO_MAT,the names of the newly created master data table and text table are displayed under the Master data/texts tab. The name of the master data table is /BIC/PIO_MAT,and the name of the text table is /BIC/TIO_MAT.

Notice the prefix /BIC/ in the database object names. BW prefixes /BI0/ to the names of database objects of Business Content objects,and it prefixes /BIC/ to the names of database objects of customer-created BW objects.

Repeat the preceding steps to create the other characteristics listed.
CHARACTERISTICS


The column "Assigned to" specifies the characteristic to which an attribute is assigned. For example,IO_MATNM is an attribute of IO_MAT.

The Material Description in Table will be treated as IO_MAT's text,as shown in Table,"Creating InfoPackages to Load Characteristic Data." We do not need to create a characteristic for it.

IO_SREG and IO_SOFF are created as independent characteristics,instead of IO_SREP's attributes. Section 3.6,"Entering the Master Data,Text,and Hierarchy Manually," explains how to link IO_SOFF and IO_SREG to IO_SREP via a sales organization hierarchy. "InfoCube Design Alternative I—Time-Dependent Navigational Attributes," discusses a new InfoCube design in which IO_SOFF and IO_SREG are IO_SREP's attributes.

BW provides characteristics for units of measure and time. We do not need to create them.From Administrator Workbench,we can verify that the characteristics in Table have been created by clicking InfoArea–demo,and then clicking InfoObject Catalog–demo: characteristics.


Creating Info Objects-Key Figures

Next,we start to create the keys.

Work Instructions
Step 1. Right-click InfoObject Catalog–demo: key figures,and then select Create InfoObject.
Step 2. Enter a name and a description,and then click to continue.
Step 3. Select Amount in the block Type/data type,select USD as the Fixed currency in the block Currency/unit of measure,and then click to check the key figure. If it is valid,click to activate the key figure.

Result
You have created the key figure IO_PRC. A status message All InfoObject(s) activated will appear at the bottom of Screen.

Repeat the preceding steps to create other key figures listed.
KEY FIGURES


From Administrator Workbench,we can verify that the key figures in Table have been created (Screen) by clicking InfoArea–demo,and then clicking InfoObject Catalog–demo: key figures.

Having created the necessary InfoObjects,we now continue to create the InfoCube.

Creating an InfoCube

The following steps demonstrate how to create an InfoCube,the fact table and associated dimension tables,for the sales data shown in Table

Work Instructions
Step 1. Select Data targets under Modelling in the left panel. In the right panel,right-click InfoArea–demo and then select Create InfoCube….

Step 2. Enter a name and a description,select the option Basic Cube in block InfoCube type,and then click to create the InfoCube.

Note: An InfoCube can be a basic cube,a multi-cube,an SAP remote cube,or a general remote cube.A basic cube has a fact table and associated dimension tables,and it contains data. We are building a basic cube.

A multi-cube is a union of multiple basic cubes and/or remote cubes to allow cross-subject analysis. It does not contain data. See,Aggregates and Multi-Cubes,for an example.

A remote cube does not contain data;instead,the data reside in the source system. A remote cube is analogous to a channel,allowing users to access the data using BEx. As a consequence,querying the data leads to poor performance.

If the source system is an SAP system,we need to select the option SAP RemoteCube. Otherwise,we need to select the option Gen. Remote Cube. This book will not discuss remote cubes.

Step 3. Select IO_CUST,IO_MAT,and IO_SREP from the Template table,and move them to the Structure table by clicking

Next,click the Dimensions… button to create dimensions and assign these characteristics to the dimensions.

Step 4. Click,and then enter a description for the dimension.

Note: BW automatically assigns technical names to each dimension with the format <InfoCube name><Number starting from 1>.

Fixed dimension <InfoCube name><P|T|U> is reserved for Data Packet,Time,and Unit. Section,"Data Load Requests," discusses the Data Packet dimension.

A dimension uses a key column in the fact table. In most databases,a table can have a maximum of 16 key columns. Therefore,BW mandates that an InfoCube can have a maximum of 16 dimensions: three are reserved for Data Packet,Time,and Unit; the remaining 13 are left for us to use.

Repeat the same procedure to create two other dimensions. Next,click the Assign tab to assign the characteristics to the dimensions.

Step 5. Select a characteristic in the Characteristics and assigned dimension block,select a dimension to which the characteristic will be assigned in the Dimensions block,and then click to assign the characteristic to the dimension.
Step 6. After assigning all three characteristics to their dimensions,click to continue.
Step 7. Select the Time characteristics tab,select 0CALDAY from the Template table,and move it to the Structure table by clicking
Step 8. Select the Key figures tab,select IO_PRC,IO_QUAN,and IO_REV from the Template table and move them to the Structure table by clicking.
Next,click to check the InfoCube. If it is valid,click to activate the InfoCube.

Result:
You have created the InfoCube IC_DEMOBC. A status message InfoCube IC_DEMOBC activated will appear at the bottom of Screen.

Summary

In this chapter,we created an InfoCube. To display its data model,you can right-click InfoCube–demo: Basic Cube,then select Display data model….

The data model appears in the right panel of Screen .

Note:
IO_SREG and IO_SOFF are not listed under IO_SREP as attributes; rather,they have been created as independent characteristics. "Entering the Master Data,Text,and Hierarchy Manually," describes how to link IO_SOFF and IO_SREG to IO_SREP via a sales organization hierarchy. "InfoCube Design Alternative I— Time-Dependent Navigational Attributes,"discusses a new InfoCube design in which IO_SOFF and IO_SREG are IO_SREP's attributes.


---END---

Jan 23, 2013

SAP BusinessObjects Analysis Workbook and SAP BW


Hello Everyone!

This blog would demostrate that with SAP BusinessObjects Analysis edition for MS Office release 1.3 is possible, finally, to save workbook on SAP BW.

The previous realease of this frontend tool allowed to save workbook only on the BI platform.

The file format that you can store are: xls,xlsx, ppt and pptx and is necessary on SAP BW have an role that contain the authorization object R_RS_AO.


aut_obj_aoffice.PNG

To save an workbook on SAP BW is very simple : after the workbbok is developed , selecting the Office Button , is available the function "Save Workbook" and "Save to SAP NetWeaver".
analysis_bw1.png
Then a window appear that permit to choice where save the workbook: in a Role or in the folder "My documents".

analysis_bw2.png

In SAP NetWeaver Business Warehouse, Analysis objects are stored with object type AAOE (for workbooks) and AAOP (for presentations).
When the user, access to SAP BW by SAP GUI, the workbook will be visible on the menu:

analysis_bw3.png
To launch the analysis workbook from SAP menu is necessary SAP Netweaver BW 730 SP8 (see SAP Notes 1724842).

Jan 21, 2013

Customer specific adjusting of BEx web-based variable screen


1 Introduction

The possibilities of adaptation of a web-based report dialog variables were previously restricted. About parameters of the WebTemplate and using the Web Design API that can be charged affects the behavior of Web Templates in the variables but not the layout and processing logic of the input

Figure 1.1: SAP Standard Variable Dialog

With patch NW730 BI JAVA SP08 Patch 30 (see also Note 1622306),

SAP offers a possibility the layout and processing logic for the following dialogues with respect to variable processing to adapt:
Variables
Dialogue
Filter

For customer-specific adaptation of the variables dialog, two alternative routes are available:
Customized formatting and positioning
Customer-specific layout and processing logic

The principle of implementation is the same for all kinds of adjustment. About a Web item types of Individual expansion of the BEx Web runtime, an HTML and / or JavaScript code segment (Snipplte) is passed. The BEx Web runtime replaces the standard SAP code passed by the code segments. Thus, the BEx Web runtime performs this replacement process, certain conditions must be met. I go even further down into the details of the implementation.

2 Customized formatting and positioning

The first way is to adjust the variable dialog customized, positioning to the individual elements of the variables dialog customized. For determining the positions of the individual elements can be any HTML tags are used. For the individual elements are patterns (pattern) are available which can be placed within a customized HTML text.

The following items are available:
Area variants
Areaersonalize
Eachvariable of the report
OK-Button
Check-Button

The pattern will be placed as a custom XML tags in customized HTML coding. The BEx Web runtime environment recognizes the pattern and replaces them with the necessary coding.

Figure 2.2 shows in (1) a custom dialog variables in the areas of personalization options and were just like the OK button and check positioned similar to the standard variable dialog.

The variables were divided into time-related variables, and not time-related variables. To better highlight this structure for each type, a separate group was formed.


Figure 2.1: Customer-specific formatting and positioning
Adjustment in (2) illustrates the use of more complex HTML components. Here, only the time-related variables shown directly and all other variables are hidden on a tray. This allows the variable dialog for reports with a lot of variables to be made ​​clearer and thus the ease of use increased.

The implementation of the component tray used here is purely on HTML and JavaScript, and needs no round-trip.

This representation could be achieved through a personalization that could not be controlled centrally.

3 Customer Individual Variable dialog
Another option is to adjust the variable dialog to make the layout and processing logic for each variable individually customized.

In this variant is not the SAP standard HTML coding of the entire variables dialogue replaced by customer-specific HTML coding but only the ranges for the input variable values. In the Variables dialog in Figure 3.1, the SAP standard HTML coding for the two variables CURRENT PREVIOUS YEAR PERIOD
YERA PERIOD and was replaced by customized HMTL code.


Figure 3.1: Individual customer's variables dialog

For the example implementation shown in Figure 3.1 has been deposited adjacent to the surface for the input of a very specific period still additional JavaScript code, through which a function of the two variables and PREVIOUS YEAR CURRENT PERIOD YEAR PERIOD was implemented.

Validation and adjustment of variable values

When entering a value for a period of two variables is automatically checked whether the variable value of the other period, according to custom rules, is still
valid. This is not the case; the value is adjusted according to the rules directly.

Such validation and adjustment is not possible without this extension, since it is in the customer exit in I_STEP 3 is not possible to override the values of the user.

Analogous to the implementation of a customized variables dialogue must also be replaced by a Web item types from individual extension of the SAP standard HTML code. In this variant, for each variable of a Web item types must Individual expansion in WebTemplate be deposited.

For the implementation of custom HTML code for some HTML elements are also patterns provided. For these HTML elements are patterns available:
Input Feld
Dropdown-Box
Label

The pattern is used to facilitate the creation of a portal layout compliant HTML code, but they are not to use it. Some properties of the extension can be customized via parameters from the Web item type Individual expansion in WebTemplate.

For each extension the BEx Web runtime environment add a standard variable input field automatically into the layout. About the Web item parameters, you can control whether the input field should be displayed above or below the user-defined layouts.

Standard input field
Using JavaScript, it is also possible to hide the standard input field. Important is that it is available within the HTML page. Also, the button for the F4 help can be hidden using JavaScript if it is not needed.

The aim of the implementation is to fill this field with the variable value.

Layout
In the current version you some adjustments at the layout of are necessary. This applies, for example, the width of the dialog variables; the height of the row in a customer-specific adaptation is embedded. Positioning of the standard input field for the variable value.

4 Customized F4 and filter dialogs
Another way of displaying variables is the customer-specific adaptation of the F4 and filter dialogs. Figure 4.1 shows two different implementations of an F4 input help dialog for the variable ZTK_0I0DAYS. In the above example, the values ​​are displayed with a reference period.

Dependencies between variables
The F4 help dialog is used explicitly for a variable. In this variant, it is not possible to influence the values of another with. Technically, the dialogue contains
an extra field that contains the value of the variable. This field is closely associated with the variable. The value of this field is passed when you close the dialog via the OK button of the dialog variables for exactly that variable. The extension replaces only the HTML code within the F4 help dialog.


Figure 4.1: Individual customers F4 and filter dialog

For each dialogue has its own Web item types of Individual expansion in WebTemplate provided. Here it is possible to reuse the implementation. You want an individual F4 help dialog for variable 0I_CALMONTH (based on 0CALMONTH) Implement. At the same time you want, however, that if the user in the report a filter to the feature 0CALMONTH applying the filter dialog has the analogous behavior as the F4 help dialog. You can do this in the Web item you both use the same implementation class. It is equally possible to implement different dialogues.

5 Implementation
The implementation of all the extensions described above is always the same principle. Figure 5.1 shows the architecture of the individual extensions.


Figure 5.1: Architecture – SAP Standard

The number of implementations of the Web item types of Individual expansion may increase due to the many possible combinations quickly. To every implementation of a Web item types of Individual expansion ever heard an implementing ABAP OO class.

Using a BAdI, the different implementations to be better organized and structured. It also provides the advanced architecture of the BAdI framework
the ability to create templates that simplify the implementation costs of new implementations and greatly shorten. Additionally, a fallback implementation is stored in the event that an implementation is not available.

Figure 5.2: Architecture - SAP standard with BAdI

~~~END~~~